The Nitro NG Creator Economy Index · Edition One · August 2026
There is a picture of the creator economy that comes from Lagos billboards and influencer rate cards: big brands, big budgets, big names. The data tells a different story. Between May and August 2026, The Nitro NG processed 15,345 promotion orders from 4,773 registered users, and the average order was about ₦1,200.
This is not a market of agencies moving millions. It is a market of thousands of ordinary Nigerians, creators, musicians, tailors, phone sellers, churches and side hustlers, spending the price of a decent lunch to get their work seen. They buy small, they buy often, and two out of three of them come back and buy again.
This is the first edition of The Nitro NG Creator Economy Index, a quarterly report on what Nigerians actually spend to be visible online, built from our own anonymised order data. These are raw platform counts, not estimates or survey answers.
₦1,200 is the average promotion order placed by a Nigerian creator or business. 66% of all orders go to Instagram, on a platform where TikTok has the larger Nigerian audience. 55% of Instagram follower spend goes to targeted Nigerian followers, despite them costing 4.5 times more than the untargeted alternative.
The ₦1,000 economy
The defining feature of this market is how small and how frequent the purchases are.
| Measure | Value |
|---|---|
| Orders processed, May to August 2026 | 15,345 |
| Registered users | 4,773 |
| Average order value | about ₦1,200 |
| Orders completed successfully | 91% |
| Buyers who ordered more than once | 66.4% |
Two out of three orders run through the cheapest tier, Budget, which trades a lower price for no refill cover. Nigerians are price aware to the last naira, and the market has organised itself around that: on Telegram, the average order is just ₦187.
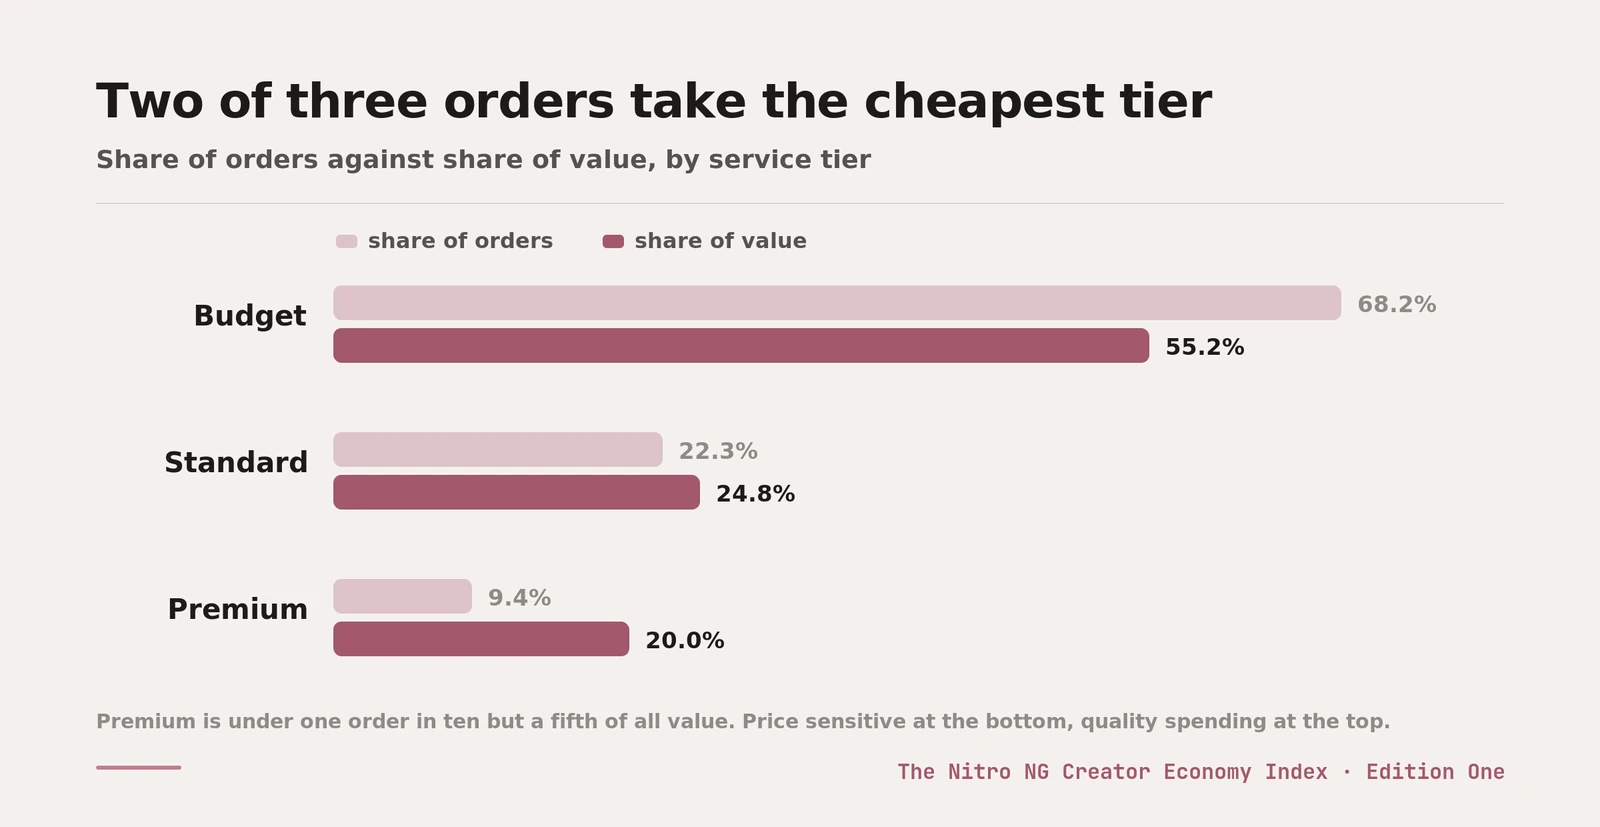
This has a practical meaning for anyone selling to or building for Nigerian creators. The market is not gated by wealth. At ₦1,000 a time, visibility is something a student, a barber or a new brand can buy weekly, and they do.
Instagram takes the money. TikTok takes the time.
TikTok is the platform Nigerians spend the most hours on, with the largest ad reach in the country. But when Nigerians spend money to be seen, they spend it somewhere else.
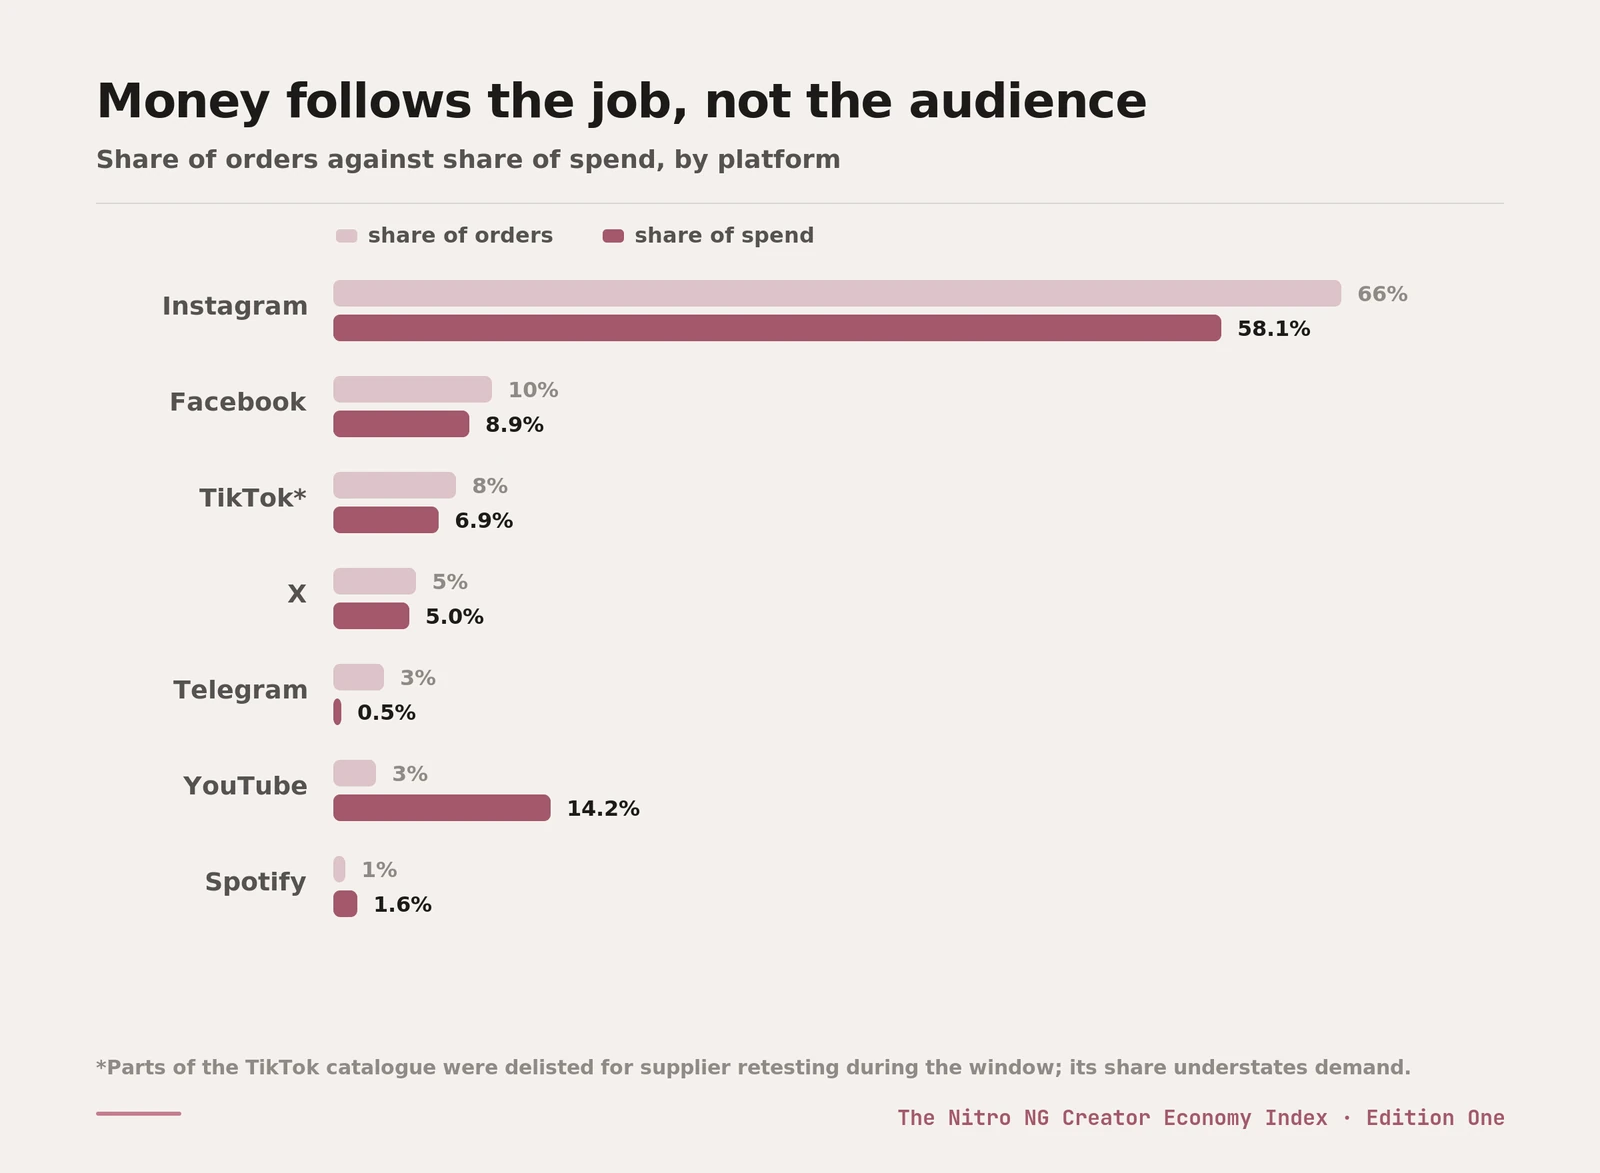
Instagram takes 66% of all orders and 58% of all spend. TikTok takes 8%, on a platform with several times Instagram's Nigerian audience.
One caveat is worth stating plainly. Parts of the TikTok catalogue were delisted for supplier retesting during this window and only fully relisted in the second week of August, so TikTok's raw share understates demand. The concentration on Instagram holds across the full period regardless.
The gap says something about how Nigerians use each platform. TikTok is where content travels. Instagram is where you are judged. It is the profile a customer checks before paying, the page a brand checks before a deal, the grid a stranger checks before taking you seriously. Nigerians entertain on TikTok and present themselves on Instagram, and they pay to look good where the judgement happens.
The serious money is on YouTube
YouTube is 3% of orders and 14% of all spend. At ₦6,336, the average YouTube order is nearly six times the average Instagram order.
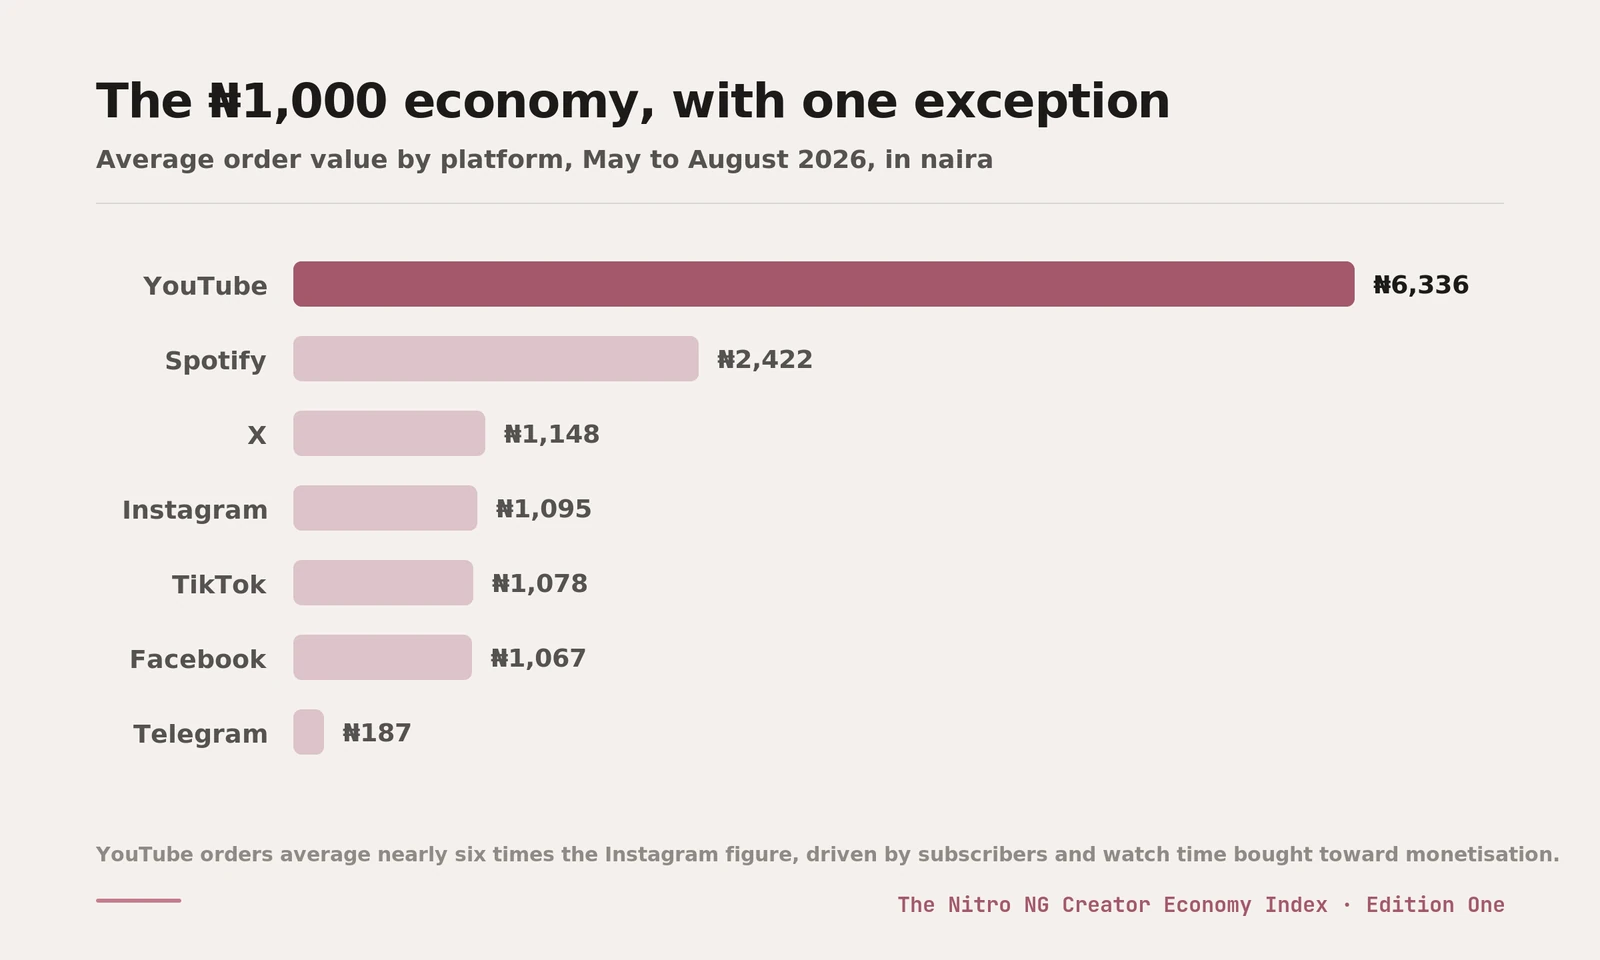
The explanation is what YouTube orders are for. Instagram purchases are mostly presentation. YouTube purchases are mostly investment: subscribers and watch time bought by people working toward the YouTube Partner Programme, one of the few routes through which a Nigerian creator gets paid directly by a platform. Nigerians spend lightly on looking good and heavily on getting monetised.
Music tells the same story at smaller scale. Spotify orders average ₦2,422, twice the Instagram figure, driven by artists treating streams as a career expense rather than a vanity number.
The targeting premium: real Nigerian attention costs more, and serious buyers pay it
The most striking pattern in the data is what happens when buyers are offered a choice between untargeted global engagement and targeted Nigerian engagement.
Untargeted engagement can come from anywhere in the world. It raises the number. Targeted Nigerian engagement comes from real Nigerian accounts, the audience that can actually visit your shop, stream your song or buy what you sell. Supply of that is far scarcer, and it is priced accordingly.
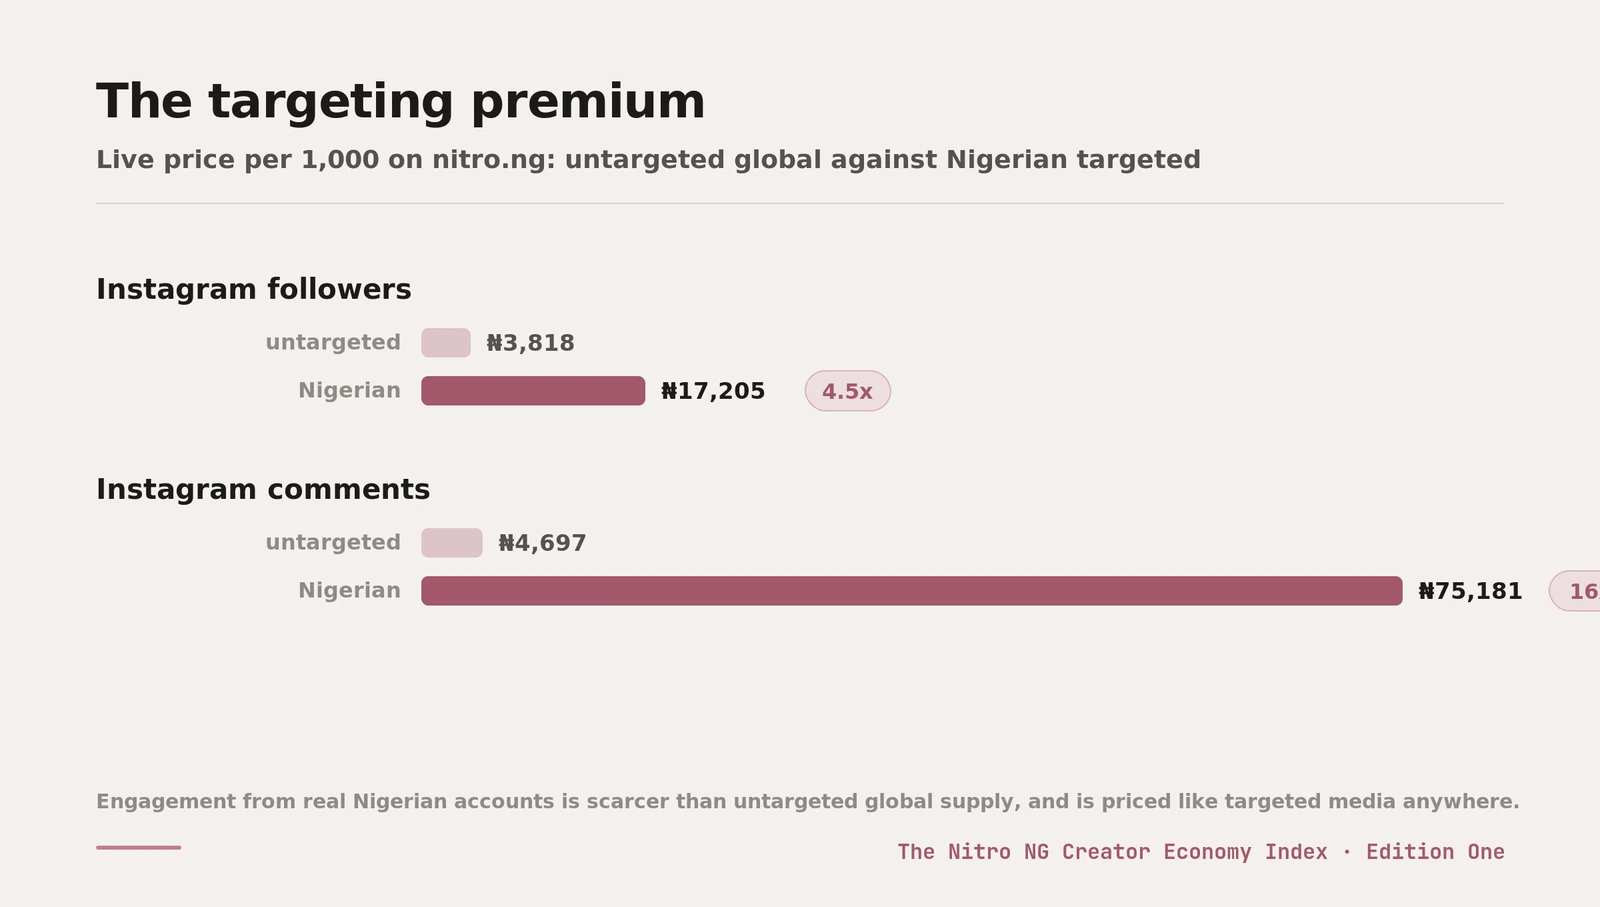
The market splits cleanly along that line. By order count, untargeted followers outsell Nigerian followers three to one. But by value, Nigerian followers take 55% of all Instagram follower spend, ₦4.12 million against ₦3.33 million, from a quarter of the orders. The average targeted order is ₦5,675 against ₦1,559 untargeted.
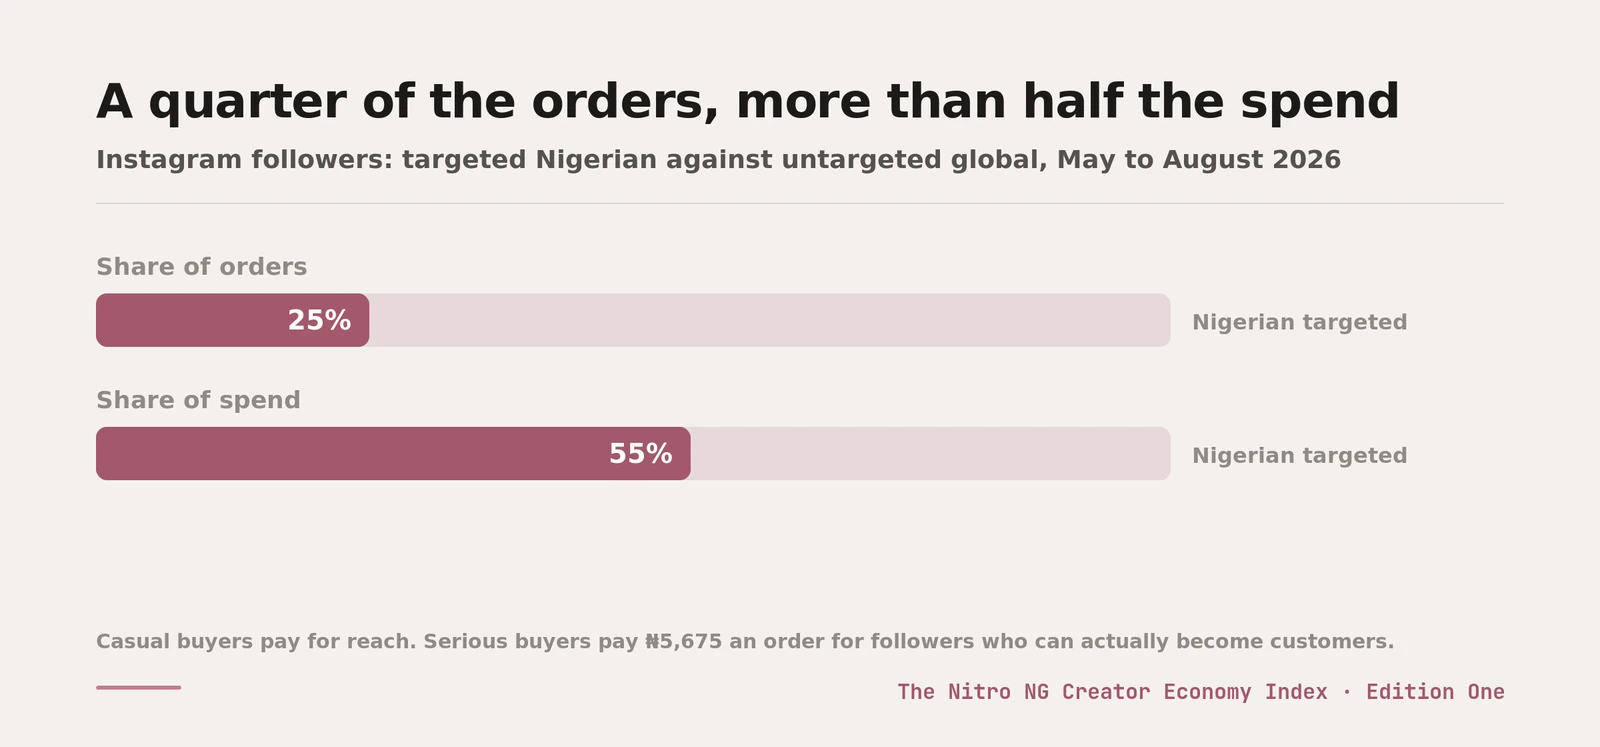
In other words, the casual buyer pays for reach and the serious buyer pays for relevance. A creator who wants a bigger number buys global. A business that wants customers in Surulere pays 4.5 times more for followers who could actually walk in. The targeting premium is not a quirk of this market. It is how advertising prices everywhere, showing up in a place most people assume is only about inflating numbers.
A habit, not a stunt
The popular image of buying promotion is a one time act of desperation before a launch. The data shows a routine instead.
66.4% of customers who complete one order go on to place another, and active buyers average well over ten orders each. Combined with the small average order size, the picture is of promotion treated like airtime: a regular, budgeted cost of running a presence online, topped up as needed.
Speed is part of why. The median Instagram order completes in under 20 minutes, and the median Telegram order in about 6. When visibility costs ₦1,000 and arrives before your food does, it stops being an event and becomes maintenance.
What this says about Nigeria
Three things, none of which show up in the usual creator economy coverage.
The creator economy here is bottom up. The spend is thousands of small purchases by ordinary people, not campaigns by brands. Anyone building tools, payments or platforms for Nigerian creators is building for the ₦1,000 customer, not the ₦1 million one.
Platforms are jobs to Nigerians, not just apps. TikTok for reach, Instagram for reputation, YouTube for income. The money follows the job, which is why the platform with the most attention takes the least spend.
Relevance is the premium product. The willingness of Nigerian businesses to pay 4.5 to 16 times more for targeted local engagement says the market is maturing past raw numbers toward audiences that convert.
About The Nitro NG
The Nitro NG is a registered Nigerian company, RC 9514845, based in Lagos. It operates nitro.ng, a social promotion platform built for the Nigerian market: 28 platforms, over 140 service types, priced in naira, with support on WhatsApp. The platform tests services before listing them, which is reflected in the completion and repeat figures reported above.
Methodology and disclosure
This report is built from The Nitro NG's internal order records between 1 May and early August 2026: 15,345 orders from 4,773 registered users. All data is anonymised and reported in aggregate. No user identities, account links or order details are included. Figures are raw database counts, not projections. Prices quoted are live public prices on nitro.ng at the time of writing and move with the exchange rate. Categories with fewer than 20 orders are excluded rather than reported from a small base.
Catalogue availability varied during the window. Parts of the TikTok catalogue, including its public services page, were delisted for supplier retesting during the window and fully relisted in the second week of August, so TikTok's visibility to new buyers was reduced for part of the period. Instagram was available for the full window. Platform comparisons involving TikTok should be read as indicative rather than exact.
The Nitro NG sells the services this report measures. We state that plainly so the reader can weigh it. What we can offer that outside estimates cannot is direct observation: this is what Nigerians actually bought, not what they told a surveyor.
Press and data enquiries: support@nitro.ng
The Nitro NG Creator Economy Index is published quarterly. Edition Two follows in November 2026 with a first look at seasonal behaviour heading into December.